Dynamically estimating and scaling Postgres’ working set size
How Neon automatically scales Postgres instances to keep your working set in memory
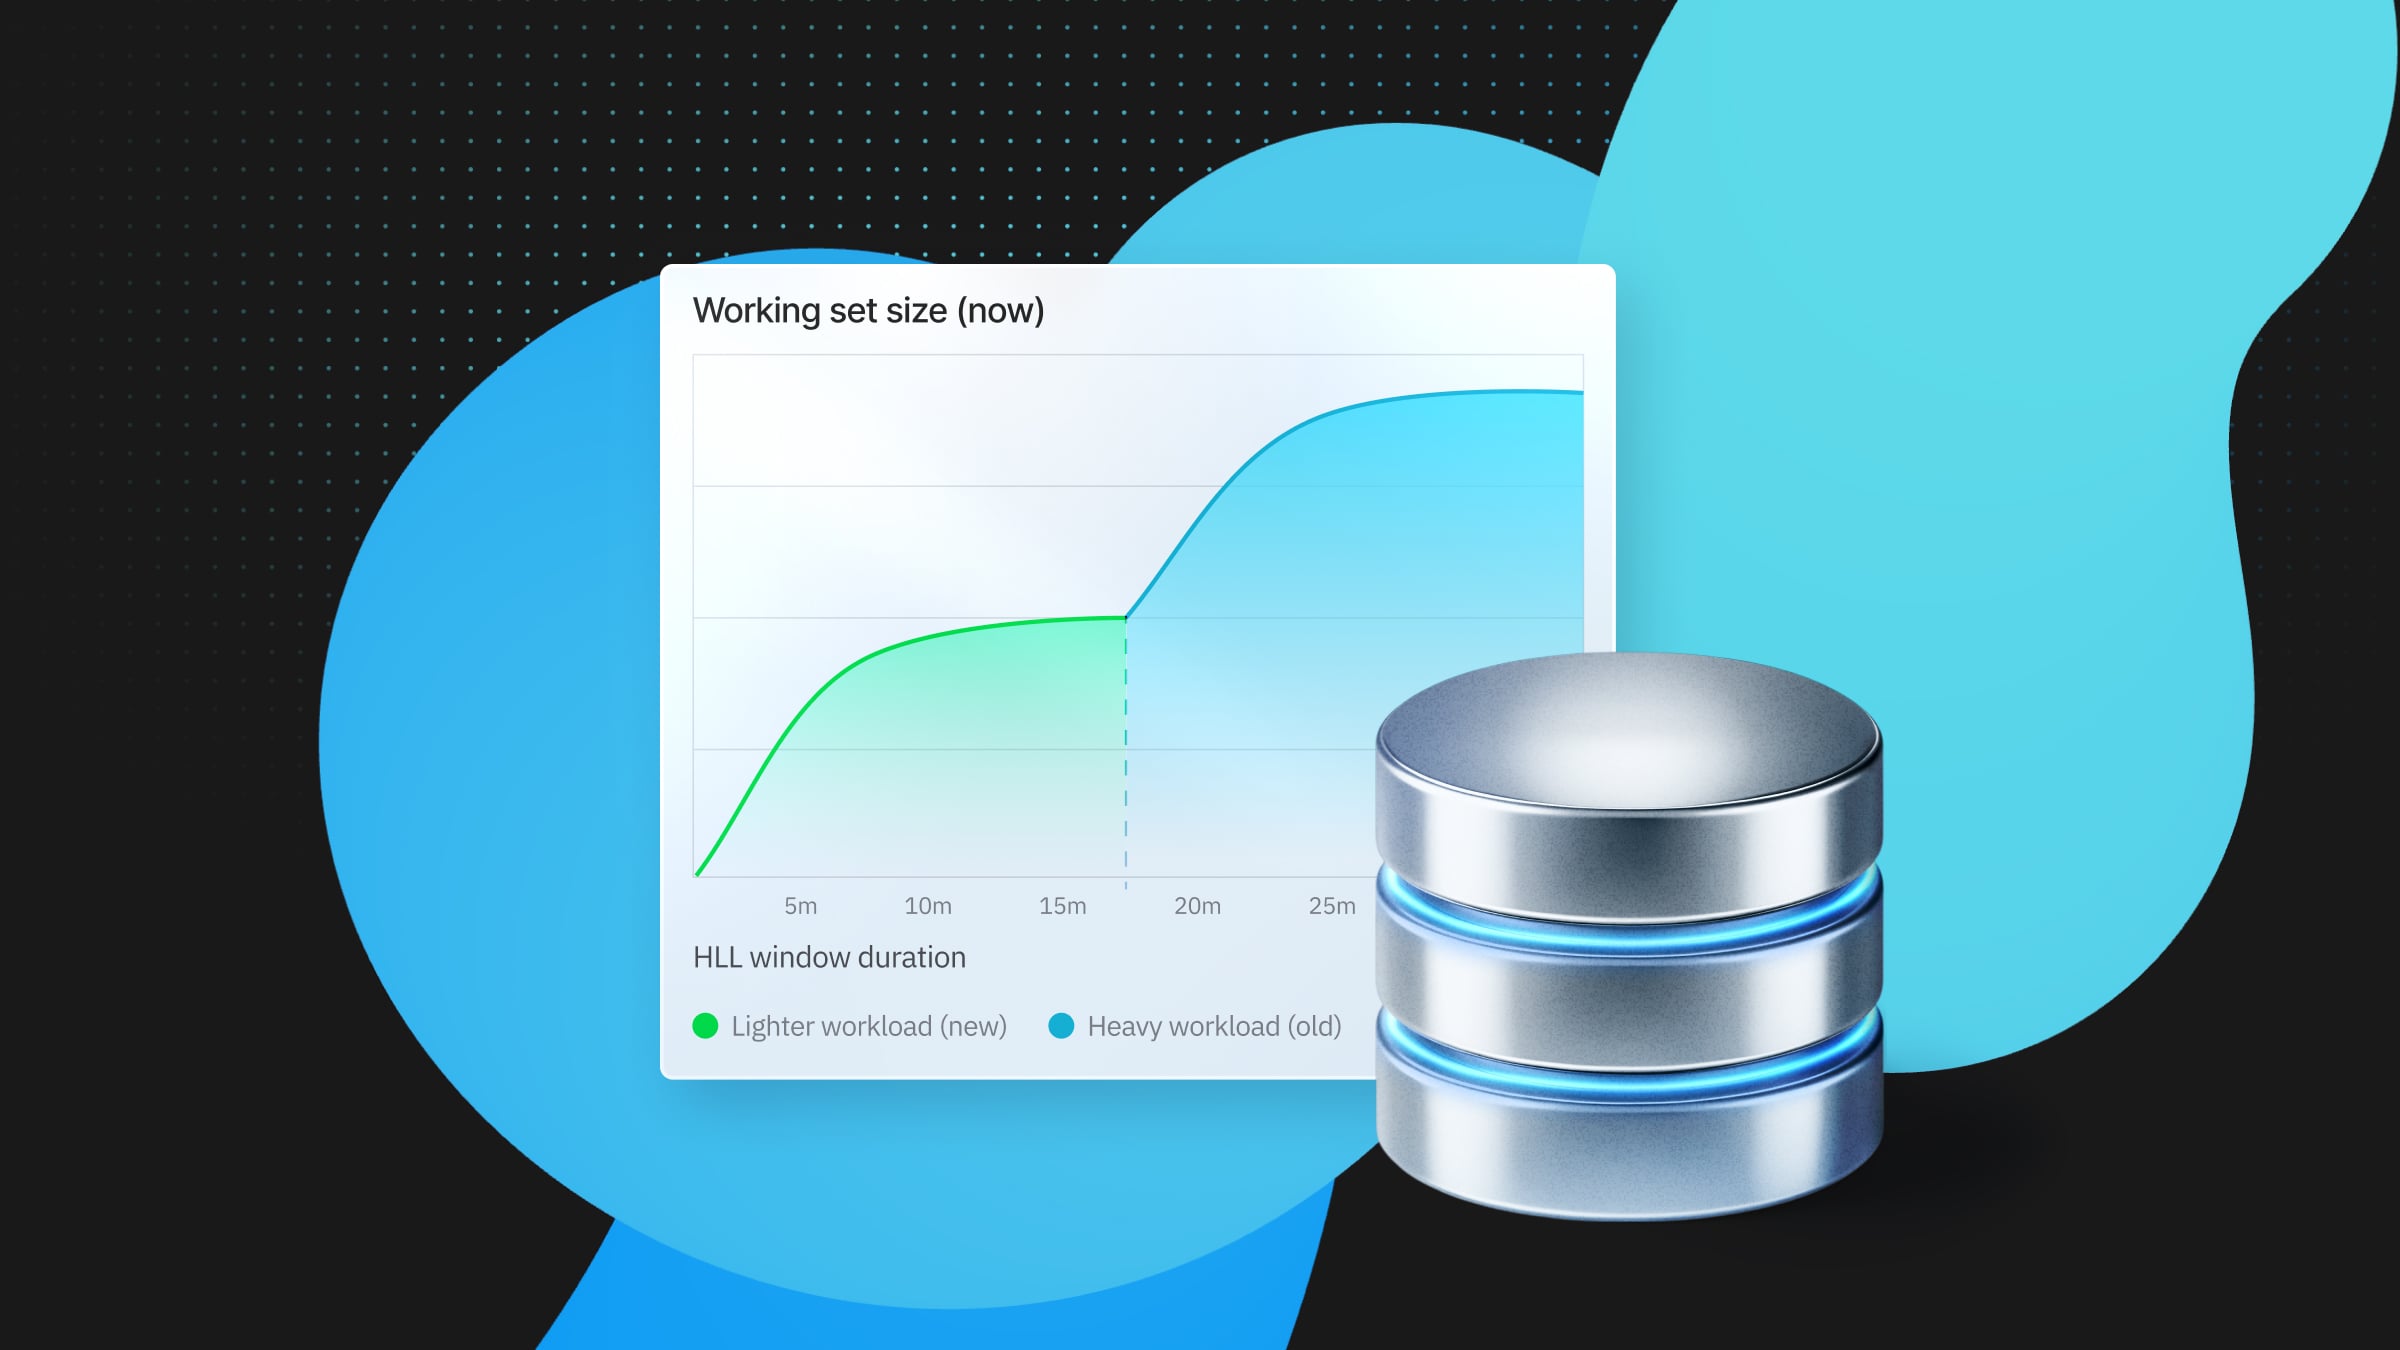
With the announcement that Neon’s autoscaling feature is GA, we wanted to take the opportunity to dive into the implementation of a recent improvement we made: Scaling to match your workload’s working set size. This can provide extraordinary speed-ups for real-world workloads, but it’s a complex problem with no single “right” answer.
In this post, we’ll look at the technical details of how we estimate the working set size and automatically scale your Postgres instance to keep the working set in memory – without breaking the bank.
Neon separates storage and compute to provide autoscaling, branching, point-in-time restore, and more. In this post, we’re only referring to scaling compute. For more on Neon’s architecture, check out this post.
Working set size: Why is it so important?
The “working set” of a database workload is the set of pages that will be accessed over the course of the workload – both the data and the indexes used to find it.
(In case you’re curious, this is a concept that also applies to workloads outside of databases – check out this great post about the memory used by applications, for example).
Workloads often suffer severe performance costs when the working set doesn’t fit in memory, and Neon’s architecture makes this even more critical, because the cost of a cache miss is a network request, rather than just reading from local disk.
In our own testing, we found that fitting the working set in memory offers up to an 8x improvement in throughput, particularly for read-heavy workloads. Moreover, because of the latency of cache misses when storage is over the network, keeping the working set in memory also provides much more predictable performance.
So sizing your instance to fit the working set in memory is critically important – but determining the right size is often difficult! And for workloads that vary over time, manually scaling either results in performance degradations under load or overspending at off-peak times.
But people already rely on autoscaling for this with CPU and memory load – so, why not scale based on the working set size as well?
Estimating working set size, part 1: HyperLogLog
In order to automatically scale to fit the working set in memory, we first need to find some way to estimate it.
Nowadays, the typical way one measures the approximate size of a set is with HyperLogLog (HLL) – a probabilistic algorithm to estimate the cardinality of a set to a high degree of accuracy with comparatively little memory.
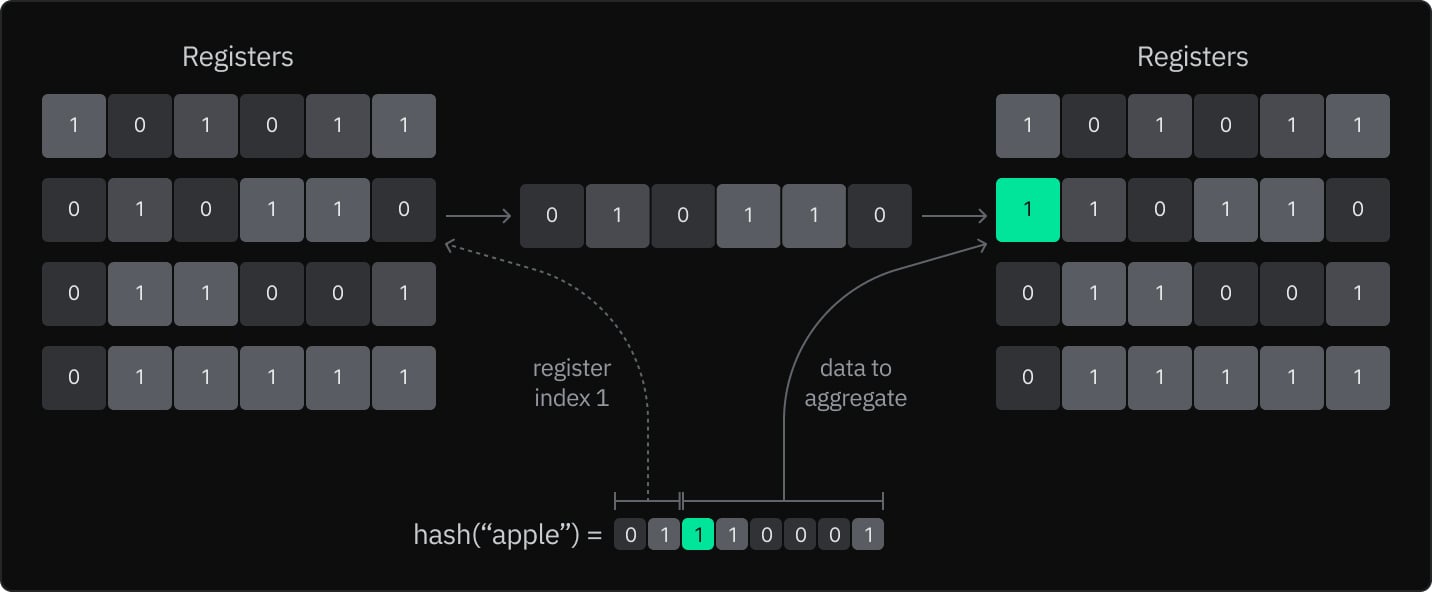
As a brief refresher in case you’re not intimately familiar:
- HyperLogLog estimates cardinality based on the number of leading zeros in the hashes of the elements
- Every time you add an element:
- Find the register index given by the first
log2(num registers)bits of the hash - Update the register by identifying the first non-zero bit in the remaining bits of the hash, and setting it in the register – e.g., with simple maximum, bitwise OR, or directly setting just that single bit.
- Find the register index given by the first
- To calculate the cardinality, use the harmonic mean of the number of leading zeros in the binary representation of each register – and adjust by a constant based on the number of registers.
(Caveat: There are many equivalent representations – we’re presenting it in this way because it more closely matches how we modify HLL in the next section.)
HyperLogLog is great for estimating the cardinality of sets with unknown size, but there’s no way to handle incremental changes in cardinality from removing elements – continually storing the maximum in each register means the information from any individual item has already been removed.
We did originally experiment with a typical HLL implementation by instrumenting page access in our custom resizable cache (LFC) to count the number of distinct pages – but since it measured the number of distinct pages accessed since Postgres started, the calculated sizes were far greater than what users were currently using.
Estimating working set size, part 2: What’s the “true” size?
So the actual working set size of your workload at a particular moment in time is somewhere between “nothing” and “everything since the start of time”. But the key question is how to find it?
One approach might be to modify HyperLogLog for a sliding window – e.g., continuously measuring the number of unique pages accessed over the last 5 or 15 minutes. There’s a couple of papers outlining how to do this efficiently. But with that approach, there’s a critical question: How big a sliding window should we use?
For steady workloads, as you increase the duration of the sliding window, the estimated size will tend to plateau around the “true” working set size of the workload. So in those cases, we could just pick some large duration that’s “probably enough” – like 1 hour or so.
But with varying workloads, such a long duration will actually prevent us from scaling down in a timely fashion. There, we need to strike a careful balance: Scaling down to make sure your compute isn’t over-provisioned while making sure not to drop the cache when it’ll incur substantial performance penalties.
From these, it was clear that just one time window won’t do.
In search of flexibility: Time-bounded HyperLogLog
At this point, we knew we’d want a selection of different sliding windows but without knowing those sizes in advance we had a dilemma: How to enable quick iteration and experimentation at a higher level (i.e., without having to frequently modify our extension in the early stages)?
One assumption that helped was that we knew we only cared about the number of distinct pages accessed between a prior time and now – rather than arbitrary windows in the past.
So, a key insight: Just replace the bits in your typical HyperLogLog with timestamps! Then, when we look for the observed working set size since time T, we count the number of leading zero “bits” by looking for the first timestamp after T.
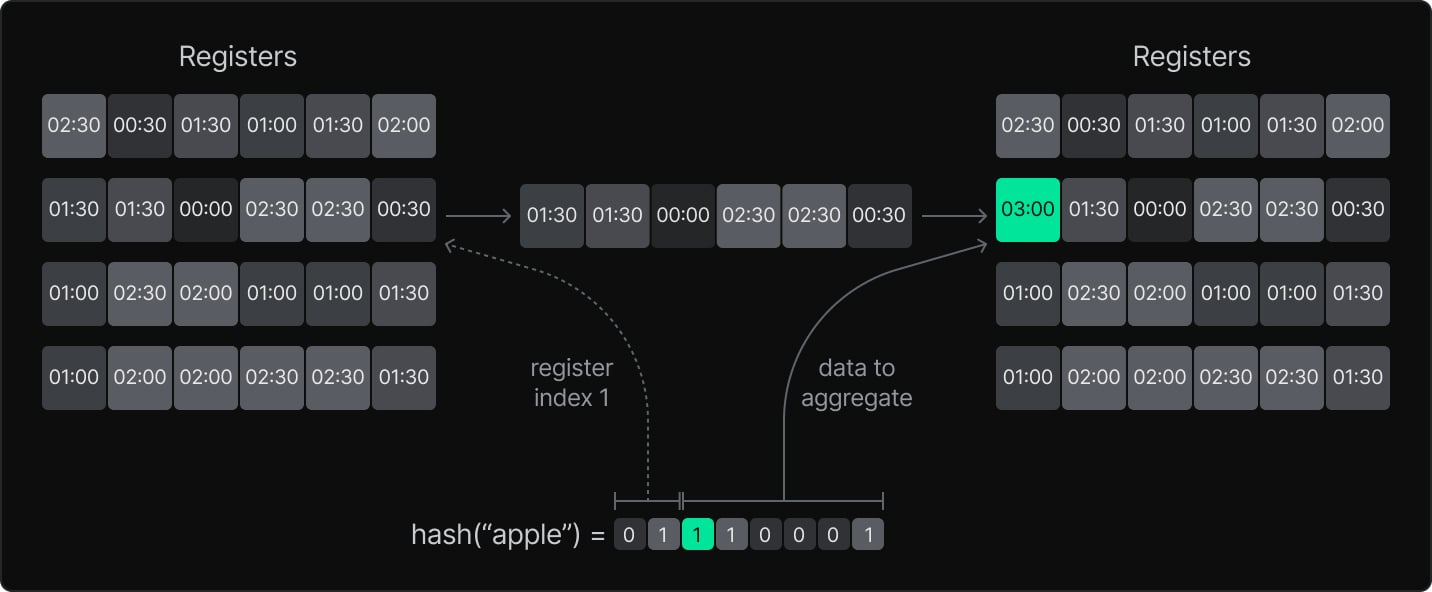
Doing this gives us a way to estimate the number of distinct pages accessed since some arbitrary time in the past, which gave us much more data to use in experimentation – and as we’ll see below, plenty of data to use in the final algorithm as well.
Pro-tip: You can try this out yourself! We implemented this as the Postgres function neon.approximate_working_set_size_seconds(d), which returns the HLL estimate of the working set size (i.e. number of distinct pages accessed) for the last d seconds. Check out our docs for more information on how to use the neon extension.
Keeping it simple: Finding a heuristic
We now come to our second key insight: At any given moment, we can observe how the working set size changes as we increase the size of the window we use. Remember how stable workloads come to a plateau? In order to handle varying workloads, instead of looking for a plateau, we should actually look for the end of a plateau – i.e. the point in the past where looking further back causes the observed working set size to increase sharply.
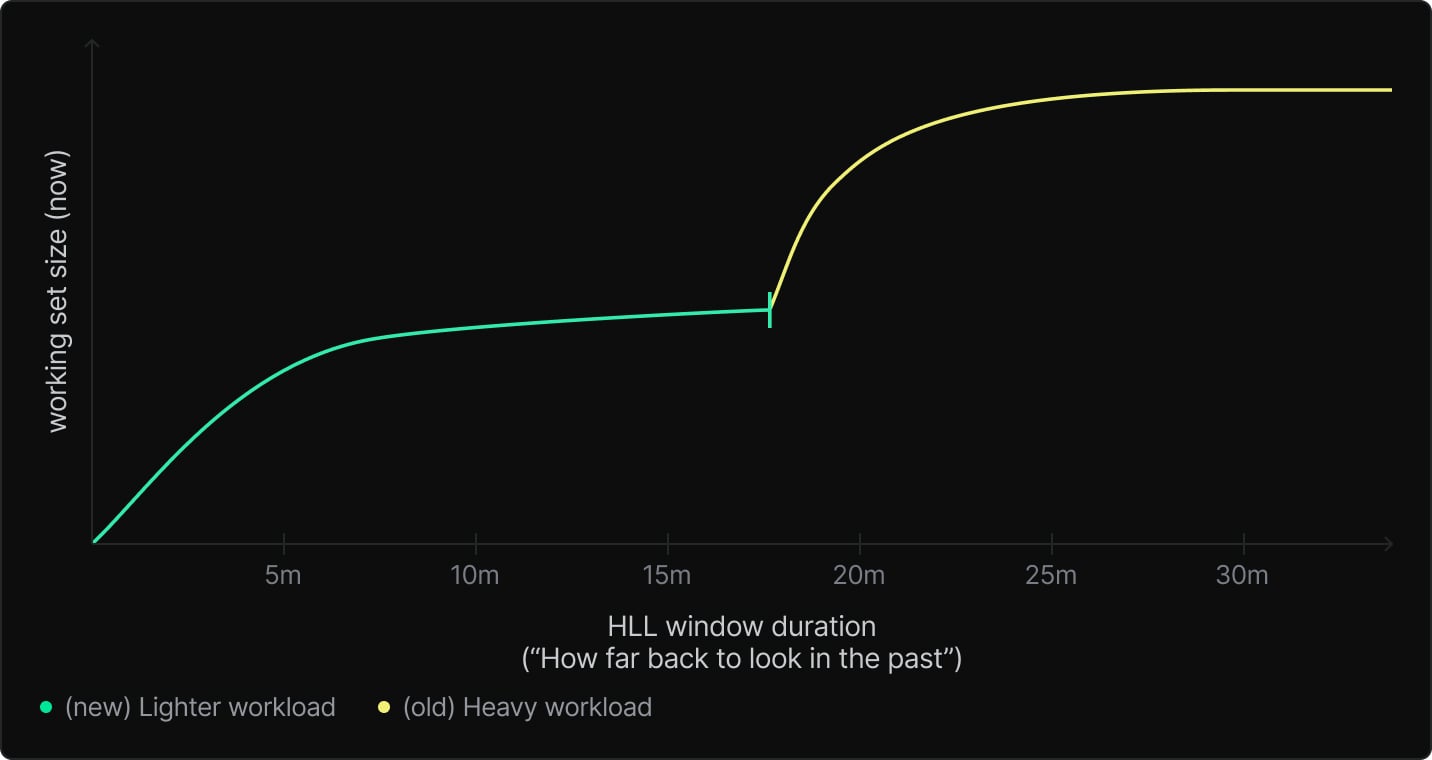
This occurs, for example, when there was a heavy workload that recently ended – if the HLL window includes that previous workload, the size estimate will be much larger. So conversely, if as you increase the window, you’ll see a sudden jump once it extends far enough into the past to include the previous workload.
There’s still a couple key questions to answer, though. So far, to estimate the “true” working set size at any particular time, we should increase the HLL window duration until we see a sharp increase. What if we don’t find one?
To put a reasonable bound on our search, we can restrict it to just the most recent hour – if we get to the end and there’s no sudden increase, that’s fine! Just use the working set size given by the 1-hour window. This is typical for stable workloads anyways, and gives us that long time window we were originally looking for.
Then, we have a concern at the other end: How do we prevent thrashing on bursty workloads?
Here, we can just start our search with some offset, and then increase the window size until we find a sharp increase in the working set size or get to the end of 1 hour. This means we’ll wait for that initial offset duration until we allow scaling down when the working set size dramatically decreases.
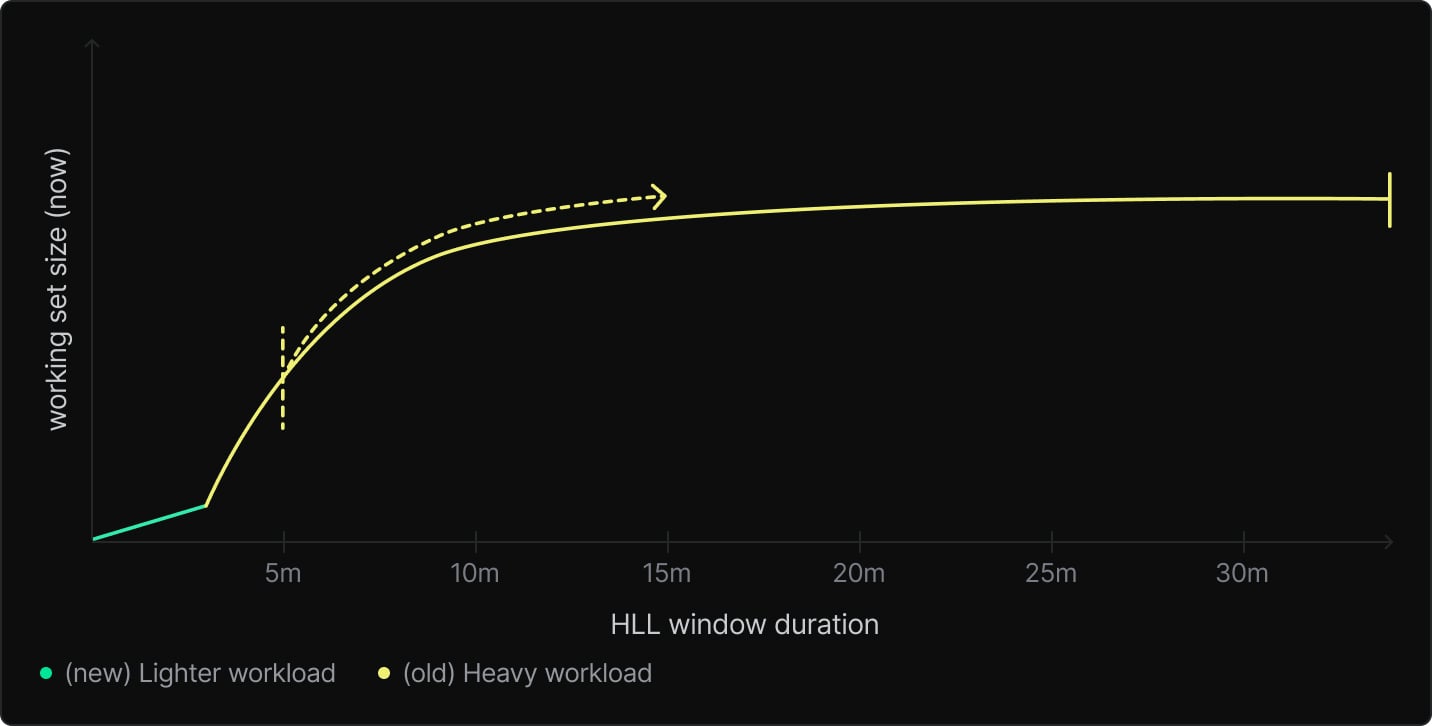
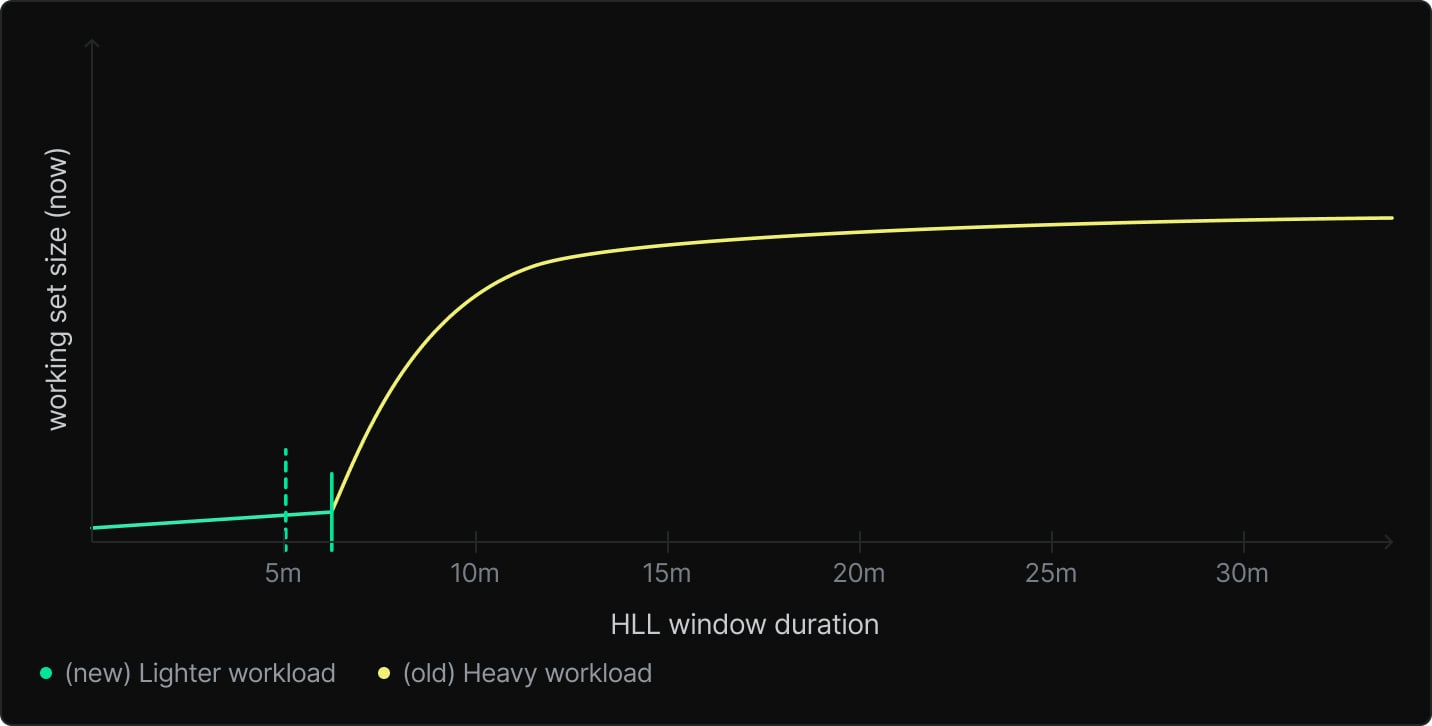
There’s no single “right” answer for how long to wait to downscale (doing it too quickly causes bursty workloads to remain slow; doing it too slow incurs extra compute costs) – we picked 5 minutes to match the default suspend timeout.
Putting it all together, we currently export the HLL metrics from each compute using sql_exporter:
select
  x::text as duration_seconds,
  neon.approximate_working_set_size_seconds(x) as size
from
  (select generate_series * 60 as x from generate_series(1, 60)) as t (x);
… and then consume these in our scaling algorithm as:
func EstimateTrueWorkingSetSize(series []float64, cfg WssEstimatorConfig) float64 {
    // For a window size of e.g. 5 points, we're looking back from series[t] to series[t-4], because
    // series[t] is already included. (and similarly for looking forward to series[t+4]).
    // 'w' is a shorthand for that -1 to make the code in the loop below cleaner.
    w := cfg.WindowSize - 1

    for t := cfg.InitialOffset; t < len(series)-w; t += 1 {
        // In theory the HLL estimator will guarantee that - at any instant - increasing the
        // duration for the working set will not decrease the value.
        // However in practice, the individual values are not calculated at the same time, so we
        // must still account for the possibility that series[t] < series[t-w], or similarly for
        // series[t+w] and series[t].
        // Hence, max(0.0, ...)
        d0 := max(0.0, series[t]-series[t-w])
        d1 := max(0.0, series[t+w]-series[t])

        if d1 > d0*cfg.MaxAllowedIncreaseFactor {
            return series[t]
        }
    }

    return series[len(series)-1]
}
All in all, this ends up pretty simple. However, as most simple heuristics do, it has some edge cases! We mitigated some of them with tuning, but scroll down to the Future improvements section for some ideas we’re thinking of.
Scaling to fit
To close the loop and autoscale based on the estimated working set size, there’s one last piece to consider.
In short: We should scale based on the projected size so that when a workload first starts, we only have to add the data to the cache once – otherwise, we risk reacting slowly and causing unnecessary cache evictions.
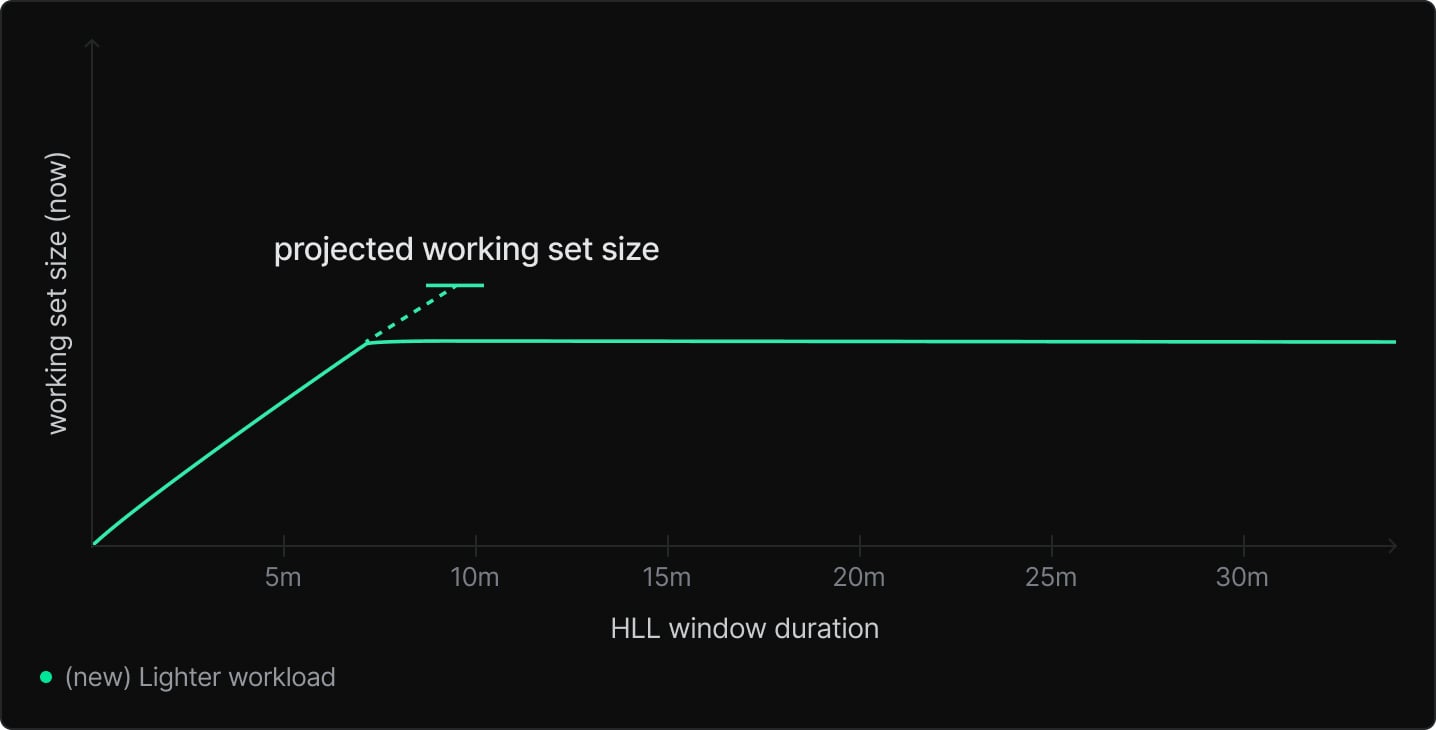
The way we currently do this is by looking at the minute-to-minute increases in working set size as window duration increases and projecting upwards. Because we fetch the HLL values every 20 seconds, we only project a fraction of a minute – both to reduce overhead, and because projecting further can cause oscillation under bursty workloads. (The “why” on that is left as an exercise for the reader 😉)
Results
How well does it work? Well in short… it works pretty well!
There were a few distinct cases we looked at.
First: in our internal benchmarking of a workload with a highly variable “target transaction rate”, we were able to match the latency and throughput of a fixed-size compute while 30% cheaper. Previously, autoscaling wasn’t able to keep up, because cache misses result in reduced CPU usage because the compute’s waiting on network requests – so we never would have scaled up to fit the working set in cache.
Elsewhere, in a sample “burst” workload (pgbench: cycle 1 minute on, 1 minute off), we found the scaling behavior changed from spiky allocations (1-3 CUs) well above the real CPU usage to a gradual increase over time, settling at a stable 3.5 CUs. We also saw a roughly 3x increase in throughput.
And finally, we also tested a “batch” workload (pgbench: 1 hour heavy workload, 1 hour reduced workload). Here, without the working set size-aware scaling, we saw the same spiky changes in allocated resources under the steady workload (between 2-4 CU) – and a cache hit rate of 30-70%. With the improved scaling, we saw it stabilize at 3.5 CUs and a cache hit rate of 100%.
In summary, we found that the improved autoscaling is more cost-efficient than fixed-size nodes with the same performance. This is a good thing, unless cache misses weren’t a concern for you under the previous algorithm anyways — in those cases, you might see increased compute time. But overall, this change brings more efficient performance to the Neon fleet.
Future improvements
There’s a few different paths we’d like to explore!
Firstly, when the working set size is bigger than the configured maximum compute size, we may end up scaling up for little benefit. This is because performance can sometimes mimic a step function based on whether the working set fits into cache — scaling up without fitting the working set may just result in increased resource usage without increased performance. Unfortunately there is no singular “right” answer here – if we just ignored the working set size entirely, there’s still workloads with incremental benefits from increased caching that might be harmed.
We’re also looking at expanding the data we provide into this algorithm — currently it’s only ever collected at a single moment in time, and this is honestly a pretty big restriction. It does help with resilience and architectural simplicity (there’s no warm-up time after the decision-maker restarts, and no external metrics database required), but there’s also distinct cases that aren’t possible for us to disambiguate otherwise.
For example, if your workload routinely fetches its entire working set in under a minute, this can trick the predictive growth step into over-estimating the future working set size. From what we’ve seen in practice, this isn’t a very common issue, but it is trivially possible to construct a workload that reproduces it.
Lastly, we’re exploring ways to move away from uniform time windows. There’s a couple problems we see:
- A fixed set of time windows can produce transient oscillations as momentary spikes in load flip between the boundaries of the windows; and
- Fixed windows make it harder to be immediately responsive and support longer time ranges – at some point, it’s just too much data to process.
Switching to an iterative algorithm (in the spirit of binary search) might particularly help with these — making it possible to consistently track the same timestamps of prior spikes with arbitrary precision on smaller time scales. But more to come on that at a later date!
Conclusion
Take that, Aurora! (just kidding. maybe.)
In all seriousness though, we’re fans of Aurora’s tech here at Neon, and with the recent publication of their paper on Aurora Serverless v2, we’re wondering if AWS is doing something similar with working set estimation. From that paper:
“[Aurora Serverless v2] introduces a metric in the engine to estimate the size of the working set in the buffer cache”
Although they also state the following:
“Aurora Serverless recommends setting the minimum [capacity] to a value that allows each DB writer or reader to hold the working set of the application in the buffer pool. That way, the contents of the buffer pool aren’t discarded during idle periods.”
Perhaps there’s room to standardize on something to get merged into Postgres upstream?
If you’ve enjoyed hearing about how this piece of Neon’s autoscaling works, check out our other engineering blog posts.

